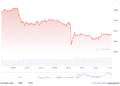



- Bitcoin (BTC) is currently trading at the $81.5K mark.
- Strong bearish momentum is seen in an established downtrend.
The leading cryptocurrency, Bitcoin (BTC), currently changes hands around $81,502, having registered a 24-hour fluctuation between $80,760 and $82,816. Additionally, the coin’s seven-day span ranges from $79,805 to $84,231, while its total trading volume rests at $25.82 billion.
Furthermore, BTC continues to display repeated accumulation signals amid its subdued price movement. Charts clearly highlight persistent bearish momentum; after dipping beneath the $80K threshold, buyers stepped in to push the asset back into the $82,000 area to regain stability.
The $83K threshold remains a key resistance barrier that Bitcoin has been unable to conquer, as sellers consistently defend this level during every test. Until the price breaks past this mark and sustains it on the 4-hour timeframe, a steady recovery cannot be confirmed. Notably, any rejection at $81.2K leaves the door open for a slide back toward the $80K level.
The Bitcoin Price Levels and Technical Momentum Trajectory
Bulls must clear the $81,647 resistance barrier. A definitive 4-hour close above that point positions $82K or higher as the subsequent target. A descending trendline near the $80K mark has already been tested and currently serves as a formidable barrier. Moreover, a breakdown beneath the $81K bracket would significantly weaken the technical outlook, shifting focus to the $78K–$76K range below $79,680, where the next critical support lies.
Technical chart indicators show that the Moving Average Convergence Divergence (MACD) line rests below the signal line. Because both indicators sit beneath the zero line, they point to powerful bearish momentum within an ongoing downtrend.
Being positioned beneath the zero line validates a broader downward market trend. Meanwhile, dropping below the signal line highlights increasing short-term selling pressure, which amplifies negative momentum. This configuration functions as a sell signal, suggesting the price will likely test lower support zones.
On the daily timeframe, the Relative Strength Index (RSI) reading of 43.94 indicates mild bearish momentum accompanied by light selling pressure, though the indicator remains in a neutral zone overall. Sitting under the 50 threshold shows that sellers currently maintain a slight advantage over buyers.
Because it has not fallen under the 30 line, the digital asset has not yet entered oversold conditions. A continued decline toward 30 would point to accelerating selling pressure, whereas a rebound past 50 would demonstrate that buyers are taking charge once again.
Crypto Market Highlights
Price Momentum: Ethereum (ETH) Sweeps the Lows and Roars Back to $2.4K
Frequently Asked Questions
What is the current trading price of Bitcoin (BTC)?
Bitcoin is trading around the $81,502 level, with a 24-hour range between $80,760 and $82,816.
What are the key resistance and support levels for Bitcoin?
Significant resistance is found at the $83K mark and $81,647, while crucial support zones sit near $80K, and further down between $78K and $76K if the price drops below $79,680.
What do the MACD and RSI indicators suggest about BTC’s trend?
The MACD line sits below the signal line and zero line, signaling strong bearish momentum and a sell signal. Meanwhile, the daily RSI reading of 43.94 indicates mild bearish pressure while remaining in neutral territory below 50.