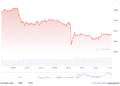


- Bitcoin is trading around $81,525, registering a more than 5% gain over the past week following a rebound from earlier lows.
- On September 18, U.S. spot Bitcoin ETFs registered $433 million in net inflows, spearheaded by BlackRock’s IBIT and Fidelity’s FBTC.
- Alex Thorn of Galaxy notes that historical data shows Bitcoin reclaiming its 50-week moving average often signals that bear-market bottoms are complete.
On September 21, the price of Bitcoin surpassed $81.5K, building upon a recovery that saw it close the previous week above a vital long-term technical benchmark for the first time in 45 weeks.
At the time of publication, BTC changed hands at approximately $81,525 after hitting an intraday peak close to $82,074. Over the week ending September 20, Bitcoin advanced nearly 6%, lifting its 35-day gains to roughly 29% and rebounding from earlier monthly lows near the $75,000 mark.
This upward momentum followed a robust rebound late last week, highlighted by $433 million in net inflows into U.S. spot Bitcoin ETFs on September 18. Fidelity’s FBTC drove these totals with about $310.7 million, alongside BlackRock’s IBIT, which pulled in roughly $108.4 million. Despite this late surge, earlier outflows meant total weekly ETF inflows settled at around $6.2 million.
Furthermore, the recent price action pushed Bitcoin back above its 50-week moving average. By closing the week above this threshold for the first time in 45 weeks, BTC crossed a marker historically monitored closely during significant market recoveries.
Bitcoin Reclaims Key Long-Term Technical Level
Alex Thorn, Head of Firmwide Research at Galaxy Research, highlighted the 50-week moving average as a critical gauge during past Bitcoin bear markets. Previous research by Thorn indicated that in four out of five concluded bear markets, reclaiming this average signaled that the market bottom was successfully established.
Historical metrics also explain the interest surrounding this weekly close. Galaxy analyzed major Bitcoin drawdowns going back to 2011 and identified 13 instances where BTC climbed back over the 50-week average. In 11 of those occurrences, the asset did not drop to a new low afterward.
This recurring pattern appeared following several major market corrections: Bitcoin reclaimed the average in 2012 after the 2011 crash, in 2015 subsequent to the 2014-15 bear market, in 2019 following the 2018 drop, and again in 2023 after the 2022 downturn. While those recoveries generally preceded substantial rallies, the indicator has occasionally experienced failed recoveries, such as during the 2021-22 timeframe.
BTC Tests Key $82K Resistance
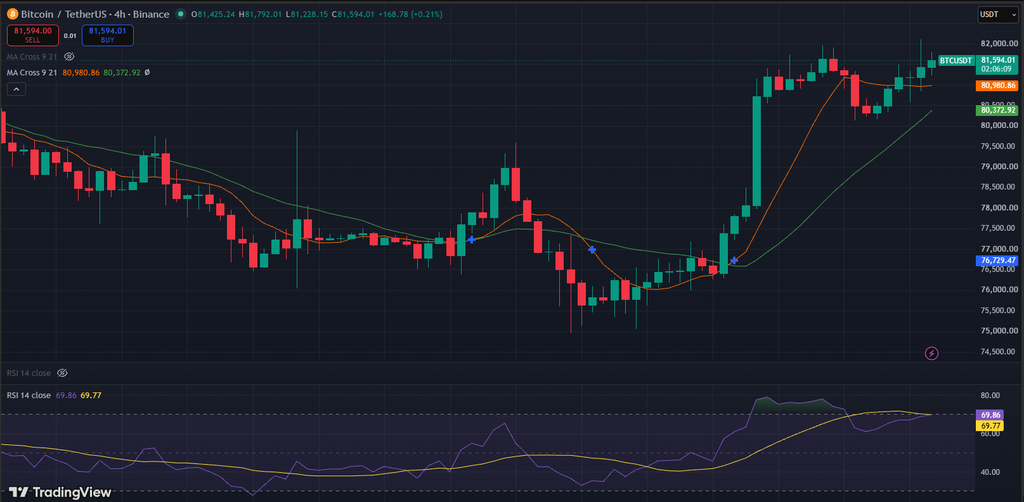
At present, Bitcoin’s 4-hour chart displays a bullish impulse coupled with subsequent bullish consolidation, showing a strong recovery out of the $76,000–$77,000 zone and consolidation near recent highs.
Examining the shorter timeframes, BTC remains positioned above its 9-period moving average near $80,981 and its 21-period moving average around $80,373, sustaining a positive short-term structure.
Additionally, the 4-hour Relative Strength Index (RSI) sits near 70, reflecting strong momentum while placing the market right near the standard overbought threshold. While this does not automatically predict a trend reversal, it demonstrates that recent gains have stretched market momentum.
With the 50-week moving average hovering in the high-$70,000 range, Bitcoin maintains a cushion of several thousand dollars above that benchmark following the latest weekly close. Consequently, maintaining a position above this line will serve as an essential test for the ongoing recovery in the weeks ahead.
The immediate obstacle sits around $82,000. Because Bitcoin has repeatedly tested this zone without achieving a definitive breakout, it functions as a primary resistance level for the current price action.
On the downside, the $80,000 region serves as the initial major support area, supported further by the 21-period moving average near $80,373 as an additional short-term reference point.
This recovery comes despite prevailing macroeconomic and regulatory uncertainties, which include the Federal Reserve’s interest rate decision and a legislative hurdle for the CLARITY Act in the Senate. Bitcoin’s ability to stay above $80,000 continues to keep market focus on whether it can successfully challenge the $82,000 threshold once again.
Frequently Asked Questions
What is Bitcoin’s current trading price?
Bitcoin is trading around $81,525, having recently reached an intraday high close to $82,074.
How did U.S. spot Bitcoin ETFs perform recently?
U.S. spot Bitcoin ETFs recorded $433 million in net inflows on September 18, led by Fidelity’s FBTC and BlackRock’s IBIT, bringing total weekly ETF inflows to about $6.2 million after earlier outflows.
Why is the 50-week moving average important for Bitcoin?
According to Galaxy’s Alex Thorn, historical data shows that when Bitcoin reclaims its 50-week moving average after a bear market, it has historically confirmed that bear-market lows are in for 11 out of 13 past instances.
What are the immediate resistance and support levels for BTC?
The immediate resistance level is around $82,000, while key support zones include the $80,000 area and the 21-period moving average near $80,373.