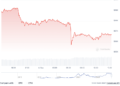



- Starknet has slipped 4%, bringing its price down to $0.059.
- The ongoing downtrend for STRK keeps sellers in complete control.
As the wider market tries to bounce back, Starknet (STRK) trades near $0.05962 following a steep 4% drop. The current price charts do not yet show a definite recovery sign, meaning the next direction relies on whether buyers can protect support levels and push momentum upward.
Holding a sustained move higher could bolster the recovery and pave the way for further gains. The token has fluctuated within a 24-hour range of $0.05851 to $0.06474, while its seven-day range spans from $0.05851 to $0.1073. Furthermore, daily trading volume has climbed to $100.259 million.
The 4-hour chart reveals a bearish outlook for Starknet, highlighted by consecutive red candlesticks. Prices could potentially slide toward the primary support level at $0.058. As bears build further momentum, a death cross could form, potentially dragging the price down to historical lows beneath $0.05754.
If a market reversal takes place for Starknet, buyers might step in and push the token back toward the resistance zone near $0.060. Continued upward pressure could spark a golden cross, gradually encouraging the price to climb toward the $0.06155 mark.
Can Starknet Momentum Flip Its Bearish Streak?
A closer look at STRK’s technical indicators reveals that the Moving Average Convergence Divergence (MACD) line remains below the signal line. Both are positioned beneath the zero line, pointing to powerful and accelerating downward momentum. Sellers maintain absolute control amid a dominant downtrend.
This momentum shift demonstrates that recent downward pressure is intensifying, increasing the probability of short-term losses. This classic bearish setup indicates that the downward trend is actively pressing forward rather than fading. Consequently, traders generally refrain from buying during this period, choosing instead to wait for a bullish crossover.
Additionally, Starknet’s daily Relative Strength Index (RSI) sits at 31.03, placing the asset right on the border of oversold territory. Intense selling pressure has fueled sharp recent declines, with sellers heavily dominating the market.
While this downward pressure could eventually ease and make a price bounce more probable—signaling that the asset is stretched too far to the downside—cryptocurrencies can remain oversold throughout robust downtrends. Traders typically watch for a bullish crossover back above the 30 threshold or a bullish divergence.
Crypto Market Highlights
1,404 Qubic Wallets Face Security Fallout After 2.94 Trillion QU Drain
Frequently Asked Questions
What is the current price of Starknet (STRK)?
Starknet (STRK) is trading around $0.05962 following a 4% decline in value.
What are the immediate support and resistance levels for STRK?
The nearest support zone sits at $0.058, with potential lows dropping below $0.05754 if a death cross occurs. On the upside, the primary resistance range is located near $0.060, with a further target at $0.06155.
What do the technical indicators say about Starknet’s trend?
STRK displays a bearish outlook. The MACD line rests below the signal line and beneath zero, indicating strong downward momentum, while the daily RSI sits at 31.03 near oversold territory.