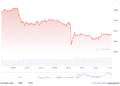



- SUI is currently trading at $1.00.
- The price is testing lower support levels.
Market sentiment is reflected by widespread red across the charts. As the bears tighten their grip, the momentum of digital assets continues to fade, with SUI recording a 4% decline among altcoins.
The asset currently changes hands at $1.00, accompanied by a trading volume of $832.436 million. Over the past 24 hours, SUI has fluctuated between $0.9956 and $1.06, while its seven-day span ranges from $0.9609 to $1.14.
Given SUI’s ongoing bearish momentum, further losses remain possible, and the token could drift downward to test its key support at $0.88. A strong downside correction might also spark a death cross, which could drive the price back toward past lows in the $0.70 region or even lower.
Should a trend reversal occur, bulls could regain control and push the price toward the closest resistance level near $1.12. If upward pressure proves robust enough to spark a golden cross, the momentum might ultimately lift the price past the $1.20 threshold.
Momentum Appears Weak on SUI’s Technical Chart
The Moving Average Convergence Divergence (MACD) line currently sits beneath the signal line, with both positioned under the zero line. This crossover points to robust bearish momentum within an established downtrend, while remaining below zero reinforces that the broader market trend is negative.
The MACD falling beneath the signal line demonstrates that short-term selling pressure is accelerating, amplifying negative momentum. This configuration typically acts as a short signal as SUI’s price is prone to further declines or tests of lower support zones.
Additionally, the daily Relative Strength Index (RSI) reading sits at 39.90, indicating moderate bearish momentum where sellers maintain the upper hand, though the asset has not yet entered oversold conditions. A reading below the midpoint of 50 shows that downward price momentum currently outpaces buying demand.
Although selling pressure is visible, the metric stays above the 30 threshold, meaning the asset is not technically oversold at this time. A drop below 30 would point to an intense wave of selling, whereas a recovery past the 45–50 range would indicate that selling pressure on SUI is subsiding.
Crypto Market Highlights
Bitcoin (BTC) Price Under Pressure as Bears Tighten Their Grip Amid Persistent Downtrend
Frequently Asked Questions
What is the current trading price of SUI?
SUI is currently trading at $1.00.
What are the key support and resistance levels for SUI?
The primary key support level is located at $0.88, with potential for deeper drops toward $0.70 or lower if a death cross occurs. On the upside, the nearest resistance level sits around $1.12, with a potential push past $1.20 if a golden cross emerges.
What do the technical indicators suggest about SUI’s trend?
Both the MACD and the RSI point to bearish momentum. The MACD line remains below the signal line and the zero mark, while the RSI sits at 39.90, indicating that sellers currently have the advantage.