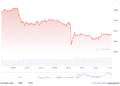



- Ethereum (ETH) is currently trading within the $2.5K mark.
- The price range now corresponds directly to a prior accumulation zone.
Ethereum (ETH), the leading altcoin, changes hands around the $2,503 level, showing a 1.1% decline alongside a volume of $9.84 billion. Liquidations reached $21.13 million over the past 24 hours. Throughout the session, prices fluctuated between $2,487 and $2,535, while the weekly span covers $2,409 to $2,621.
After dipping near $2,410, the asset quickly bounced back above $2,500—a rapid rejection highlighting continued buyer interest at reduced prices. Nevertheless, ETH remains below the $2,530–$2,550 resistance barrier, which has yet to be broken.
The accumulation structure observed during earlier cycle lows is reemerging at present prices. The current trading corridor directly aligns with a past accumulation zone.
Furthermore, ETH is positioned directly on its Weekly 200MA/EMA, a threshold that draws firm participation from both bulls and bears. This dynamic establishes the current area as one of the chart’s most vital technical points.
ETH’s Key Levels and Technical Indicators
Maintaining the $2,500 threshold sets the stage for another push upward. Conversely, dropping below $2,450 will likely trigger a retest of the $2,410 wick. Broader support is established at $2,400–$2,450, and a drop beneath this band paves the way toward $2,310. The $2,350 mark serves as the boundary preserving the ascending channel; losing it significantly undermines the recovery outlook.
Looking upward, the $2,800 marker separates Ethereum from a prospective advance toward the $3,000–$4,000 zone for the first time in more than nine months, though multiple resistance barriers must be broken first.
With both the MACD line and the signal line positioned below zero, strong bearish momentum is indicated. The macro trend trends downward with sellers in control, while the shorter-term moving average trails beneath the longer-term average.
Rather than a brief correction, Ethereum prices reflect a continuous downtrend. Market participants typically wait for the MACD line to reclaim a position above either the signal line or the zero line prior to evaluating purchase opportunities.
An RSI reading of 46.76 points to neutral-to-slightly-weak, bearish momentum. The cryptocurrency is neither overbought nor oversold, remaining locked in consolidation lacking decisive directional momentum.
Trading below the 50 midline implies that sellers maintain a minor advantage over buyers, though momentum lacks aggression. Traders generally await a move above 50 for bullish confirmation or a drop toward the oversold level of 30 before executing a position.
Crypto Market Highlights
Coins.ph Gambling Link Allegations Put Crypto Exchange License at Risk
Frequently Asked Questions
What is Ethereum’s current trading price and volume?
Ethereum is trading around $2,503, down 1.1%, with a trading volume of $9.84 billion.
What are the key support levels to watch for ETH?
Immediate support holds at $2,500, with broader support zones between $2,400 and $2,450. Losing $2,350 would threaten the ascending channel structure, while a breakdown below support could expose prices to $2,310.
What do the technical indicators say about Ethereum’s momentum?
The MACD lines are below zero, signaling a sustained downward trend and bearish dominance, while the RSI at 46.76 indicates a neutral-to-slightly-weak market caught in a consolidation phase.