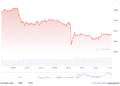



- Arbitrum has climbed 16%, bringing its current price to $0.15.
- Positive momentum has shifted the long-term outlook for ARB.
As of September 16th, Arbitrum (ARB) is changing hands around the $0.1547 level, marking an increase of over 16.2% accompanied by $530.9 million in trading volume. Over the past 24 hours, the token has traded between $0.1328 and $0.159, with the higher boundary introducing structural complexity. Meanwhile, the seven-day trading band spans from $0.1316 to $0.1721.
In addition, Standard Chartered has established a $10 price target for the cryptocurrency by the close of 2030, representing a 70x increase from current values. ARB is currently pushing into a rising wedge pattern. Although momentum remains robust, it is also growing tighter, meaning that a drop beneath the lower trendline would establish a vital downside objective.
Examining the four-hour chart, recent bullish activity could drive the price of Arbitrum toward a peak near the $0.1599 resistance barrier. Should buying pressure intensify further, a golden cross could materialize and push the asset to challenge the $0.1670 region or even higher.
Conversely, if bearish momentum takes hold in the ARB market, the price could quickly retreat to support at the $0.1482 level. A deeper correction might prompt a death cross, leading market bears to push the price beneath the $0.14 mark.
Is Arbitrum’s Technical Setup Pointing to More Uptrend?
An examination of Arbitrum’s technical momentum reveals that the Moving Average Convergence Divergence (MACD) line rests above the zero line, while the signal line remains below zero—a configuration that points to a shift from an earlier downtrend into a developing uptrend.
The positive shift in long-term trend momentum contrasts with the signal line’s position below zero, which highlights lingering historical weakness. Market participants interpret this setup as an early bullish indicator, demonstrating that a solid uptrend is forming and working to lift the broader trend out of negative territory.
Market sentiment for Arbitrum currently resides in a moderately bullish state, with the daily Relative Strength Index (RSI) resting at 62.76. This indicates that buying activity is outpacing selling pressure, though the asset has not yet entered overbought territory.
This area indicates steady, manageable upward momentum devoid of immediate exhaustion signals. Traders typically view readings in this range as evidence of constructive market strength, suggesting that buyers retain firm command and leaving space for additional gains before momentum becomes overextended.
Crypto Market Highlights
Confidential Robinhood Data Allegedly Fueled Hyperliquid Trades: Two Engineers Charged
Frequently Asked Questions
What is the current price and trading volume of Arbitrum (ARB)?
As of September 16th, ARB is trading at approximately $0.1547, up more than 16.2%, with a trading volume of $530.9 million.
What is Standard Chartered’s long-term price target for Arbitrum?
Standard Chartered has set a price target of $10 for ARB by the end of 2030, which would equate to a 70x move from current price levels.
What do the technical indicators say about ARB’s momentum?
The MACD line sits above zero while the signal line is below zero, indicating a transition from a downtrend to an emerging uptrend. Additionally, the daily RSI sits at 62.76, reflecting healthy, moderately bullish buying pressure without being overbought.