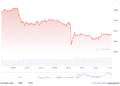



- Bitcoin (BTC) dropped roughly 2% to trade at $84,035, falling under the important $85,000 threshold as upward momentum slowed.
- While the bull market support band rises in tandem with the price, an upcoming retest represents a vital moment for the continuation of the wider uptrend.
As the leading cryptocurrency, Bitcoin (BTC) faces a pivotal juncture after dipping below the $85,000 threshold and shedding approximately 2% across a 24-hour window. The digital asset currently changes hands near $84,035, accompanied by a daily trading volume totaling $32.867 billion.
Throughout the past 24 hours, Bitcoin fluctuated between an intraday low of $83,647 and a high of $86,648. Looking at the weekly timeframe, BTC has oscillated within a $83,022 to $87,085 band, highlighting a wider consolidation range alongside critical thresholds monitored by market participants.
This downward move accompanied a flush of late long positions, resulting in roughly $500 million worth of long liquidations. Even so, a portion of that capital appears to have flowed back into the ecosystem, maintaining elevated leverage levels.
Bitcoin’s recent price action develops inside a compressed triangle formation, with the most recent movement rebounding off the lower trendline. Maintaining this technical structure could still pave the way for an upward breakout toward higher price targets.
An additional variable is Bitcoin’s bull market support band. Given that this band ascends alongside prices during bull markets, historical precedent shows that BTC frequently gravitates back toward it. Such retests can provoke bearish sentiment while simultaneously serving as vital accumulation zones for buyers, provided the wider uptrend remains intact.
For the bullish camp, reclaiming the $85,000 mark would help reinstate near-term momentum. Should BTC fail to bounce back and selling pressure persists, the lower boundaries of the recent trading range could re-enter the spotlight.
Bitcoin’s Key Support and Resistance Levels
If downward pressure intensifies, the BTC price risks sliding toward the immediate support zone around $83.9K. Should sellers maintain dominance and increase downward pressure, it could spark a death cross formation, gradually pushing the valuation beneath $83,821.
Conversely, if the market trend shifts in a bullish direction, the price could advance toward the $84.1K resistance barrier. As upward momentum gathers strength, potential buyers might spark the development of a golden cross, allowing the price to steadily climb past $84,269.
BTC Momentum Weakens: More Losses Ahead?
A four-hour technical review indicates that the Moving Average Convergence Divergence (MACD) line sits underneath the zero line, while the signal line stays above zero, pointing to mixed momentum across the Bitcoin market.
While the broader trend retains some underlying strength, short-term momentum is clearly fading. Market participants may monitor for a cross back above the signal line as an indicator of a rebound, or watch for a drop below zero if selling activity accelerates.
Additionally, the daily Relative Strength Index (RSI) stands at 35.32, signaling weak purchasing demand for Bitcoin alongside a steady drift toward oversold territory.
Crucially, the asset has not officially entered oversold territory—which is typically defined by readings below 30—though this metric demonstrates that sellers currently maintain control.
Crypto Market Highlights
Hyperliquid and MAS Clash Over Singapore’s Regulatory Reach
Frequently Asked Questions
What is Bitcoin’s current trading price?
Bitcoin is trading at approximately $84,035, having dropped about 2% over a 24-hour period.
What caused Bitcoin’s recent price drop?
The decline coincided with the flushing of late long positions from the market, resulting in around $500 million in long liquidations.
What is the significance of the bull market support band?
As the support band rises during a bull cycle, Bitcoin historically tends to revisit it. These retests can spark bearish sentiment, but they also offer important accumulation zones for buyers if the overall uptrend holds.
What do the technical indicators say about BTC momentum?
The four-hour MACD shows mixed momentum, and the daily RSI sits at 35.32, indicating weak buying momentum and showing that sellers currently hold the upper hand.